This article describes how to use DAX Studio to capture DAX queries generated by Power BI. Analyzing DAX queries can be helpful to better understand performance issues, and to improve the writing of DAX queries.
Preparing the Power BI report
Every page in a Power BI report usually creates one or more DAX queries to populate its visuals. . When you switch to a different page, new queries might be sent to the engine. Moreover, changing the selection of a slicer also generates new queries. However, Power BI also uses a cache system to avoid sending the same DAX query multiple times. Therefore, it is useful to make sure that the cache is empty in order to capture all the queries generated for a single page of a report.
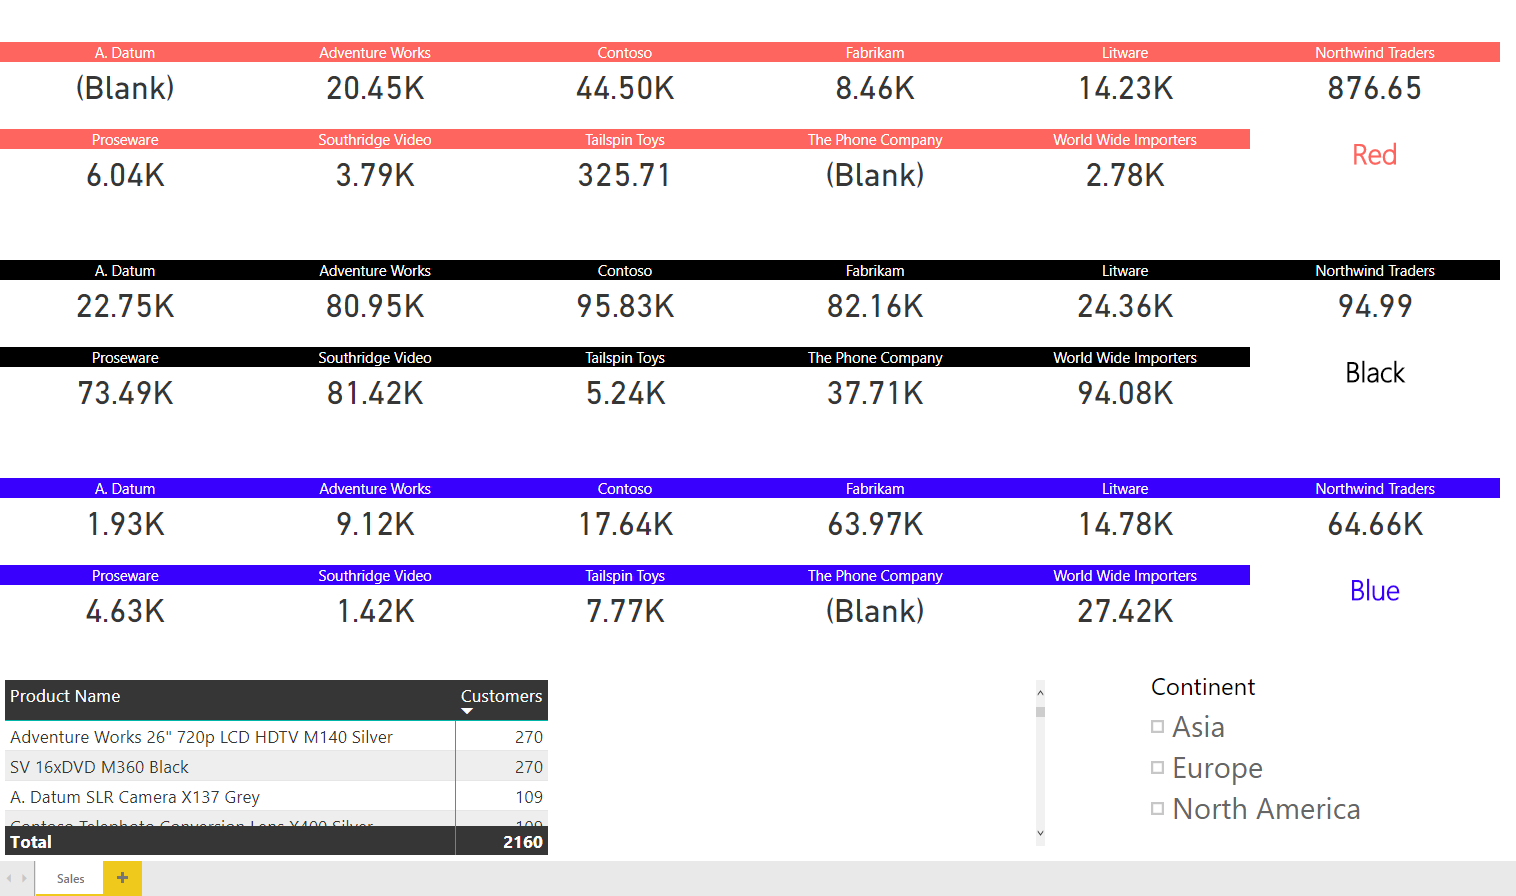
For example, consider the following report that is made up of a single page.
When the report is opened, the DAX queries are immediately generated and sent to the engine. There is not enough time to open DAX Studio and activate the trace to capture all the DAX queries: some of these queries will already be executed.
To avoid this problem and to make sure that all the queries can be captured in DAX Studio, the Power BI file should contain an empty page. Thus, you should create a new empty page and save the PBIX file ensuring that it is the current active page of the report.
This way, the next time you open the PBIX file, the empty page will be displayed and no queries will be sent to the engine until you click on another page.
Once the file is ready, close Power BI Desktop. Then, reopen Power BI Desktop and open the file that you prepared in the previous step. The empty page should appear in the report. The next step involves connecting to Power BI from DAX Studio.
Connecting DAX Studio to Power BI to capture queries
Keeping Power BI Desktop open with the empty page selected, open DAX Studio and select the PBI / SSDT Model that is open.
Click on the All Queries button in the Traces section of the ribbon.
Make sure that you see the message, “Query Trace Started” in the Output pane.
Switch to the All Queries result pane. There should be an empty list at this time. You can see that the Start button is not an available option, indicating that the trace is already running.
DAX Studio is now ready to capture all the DAX queries generated by Power BI reports.
Capturing DAX queries from the active page of your report
Keeping DAX Studio open, switch to the Power BI Desktop window and select the page of the report that displays the data.
This simple report generates many queries, which are captured and displayed in the All Queries pane in DAX Studio.
The Duration column measures the time spent resolving each query, in milliseconds. If there is a significant discrepancy between the sum of all DAX queries durations and the amount of time required to refresh the visuals in the report, that might be due to the number and complexity of the visuals included in a single page.
If a query requires a large amount of time, it is possible to review the complete DAX query with a double-click on that specific line. The entire DAX syntax is copied into the DAX Studio editor. You may run the query again using the Run button. It is better to clear the cache before running the query when working on performance optimization.
Capturing DAX queries generated by interaction with slicers
It can be useful to capture the queries generated by the interaction with one or more slicers. You can pay attention to the StartTime of the last query captured by DAX Studio, or you can clear the query list by clicking the Clear All button.
In Power BI Desktop, click the item “Europe” in the Continent slicer. DAX Studio displays the new queries generated by the interaction with the slicer.
In this case, the slowest query is caused by an issue in the Customers measure, which is the only measure used in the query highlighted in yellow in the previous screenshot. This is the initial definition of Customers:
Customers :=
CALCULATE (
    DISTINCTCOUNT ( Sales[CustomerKey] ),
    FILTER ( Sales, Sales[Quantity] > 0 )
)
By replacing the measure in the Power BI model with a more optimized version, the main performance issue of the DAX model is resolved. Here is our suggestion:
Customers :=
CALCULATE (
    DISTINCTCOUNT ( Sales[CustomerKey] ),
    Sales[Quantity] > 0
)
By repeating this cycle from the beginning, it is possible to carry on this performance improvement of DAX queries by fixing a single measure. Keep in mind, the order of the queries for the same report might be different from one execution to the next – especially if the Duration changes. In the following example, we see that for that same query that used to run in over 2 seconds, the Duration is now down to 20 milliseconds.
The time required to refresh the Power BI page examined so far is now mainly impacted by the number of visuals displayed in the same page. Each of these visuals generates a DAX query, and there are no queries taking more than 20 milliseconds to run. Further improvements to the DAX measures are no longer possible – the only possible optimization left would be to reduce the number of visuals in the DAX page, thus generating a smaller number of DAX queries.
Conclusions
When dealing with performance issues in Power BI, it is useful to understand whether the problem is caused by the DAX code in the data model, or by the number and/or complexity of the visuals included in a report page. The technique described in this article helps understand this behavior and it helps establish priorities in report optimization, or in DAX optimization.


